Atlas › Reading between the lines

Case study 141 of 198

Which health state is worse?

Given two health states, does Jev pick the one Americans value lower, and how much does that depend on how far apart they are?

result150 questions

Given two health conditions, Jev picks the one Americans value lower 83% of the time: 62% when the two are close, 86% for middling gaps and every time when they are far apart. When it disagrees, the condition it calls worse is most often the one with more trouble doing usual activities (13 of its 26 misses) or more pain (10).

gap under 0.162%
gap 0.1-0.386%
gap over 0.3100%

How to read this: Three bars, one per size of gap between the two conditions in the US value set, from close to far apart. Each shows how often Jev picked the one people value lower.

150 pairs; 90% interval [0.773, 0.88].

In short

  • Jev agrees with the US value set on which of two health conditions is worse in 83% of 150 pairs, and in all 50 far-apart pairs.
  • On the 50 close pairs it manages only 62%, and its 26 misses lean toward calling trouble with usual activities (13) or pain (10) the worse problem.
  • The people's side is a formula fitted to 1,134 American adults, and on close pairs its own uncertainty is about as large as the gap.

What the data shows

reading between the lines
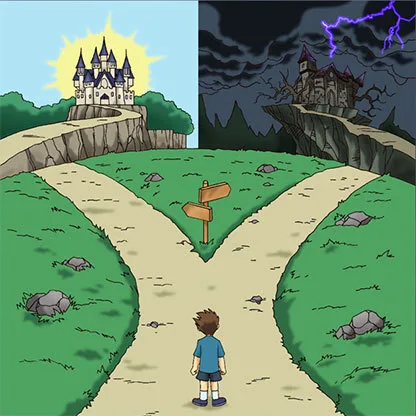
Two Paths meme: unable to do usual activities; severely anxious or depressedunable to do usual activitiesseverely anxious or depressed
How funny is this meme? Jev: 2/5, slightly funny123%263%314%40%50%
  • Overall, 83% (90% interval 77% to 88%).
  • Close pairs are a real test: 62%, only somewhat better than a coin flip.
  • Middling pairs: 86%; far-apart pairs: 100%.
  • Its misses have a pattern. In the 26 pairs where Jev picks the other condition, the one it calls worse is most often the one with more trouble doing usual activities (13) or more pain (10), and less often the one with worse mobility (7).

What it means, and what it doesn't

On clear differences Jev agrees with the public. On close calls it drifts, and the drift has a direction: the condition it calls worse tends to be the one that disrupts daily life, less often the one with worse walking problems. That fits "Worse than being dead?", where walking problems cost Jev far less than they cost people.

It doesn't mean Jev is wrong on close pairs; the formula is an average with its own uncertainty, and 50 close pairs is a small set.

Caveats

  • People's side is a formula. "Which is worse" comes from the US value set, a formula fitted to 1,134 American adults' answers, not from people comparing these exact pairs. For close pairs, the formula's own uncertainty is about as big as the gap, so a "miss" there may be no miss at all.
  • Random pairs. The pairs were drawn at random, 50 in each gap band, so many compare conditions nobody would confuse. Only the close band tests fine judgment, and it has 50 pairs.
  • The project's wording of the health descriptions. The questionnaire's level wording ("slight", "moderate", "severe", "unable to") was paraphrased, which may read differently to Jev than on the official form.

Jev on this experiment

Would a person find it interesting to read?
Yes70%
Does it describe you?
No63%
Would you have predicted it?
No55%
How fair is the comparison?
The comparison is shaky
How much should a reader rely on it?
Moderately
Which caveat matters most?
People's side is a formula89%

Why ask this

Is being unable to do your usual work worse than feeling severely anxious? Health systems answer questions like that all the time, because the values people put on health conditions help decide which treatments get paid for. Putting a number on a condition is hard; saying which of two conditions is worse is easier. If a model agrees with people on the direct comparison, any gaps in the harder rating task are about how it reads the scale. If it disagrees even here, it weighs pain, mobility and mood differently from people.

This is the companion to "Worse than being dead?", which asks Jev for a number on each condition.

How this was done

The people and the data

Both conditions in each pair are described on the five parts of the standard EQ-5D-5L health questionnaire: walking about, washing or dressing, usual activities, pain or discomfort, and anxiety or depression, each at a level from "no problems" to "extreme problems" or "unable to". The US value set (Pickard and colleagues, 2019), fitted to the answers of 1,134 American adults, gives each condition a value; the one with the lower value is the one people, on average, consider worse. 150 random pairs were drawn: 50 close together (a gap under 0.1 on a 0-1 scale), 50 middling (0.1 to 0.3) and 50 far apart (over 0.3).

What Jev was asked

Which of these two health states would be worse to live in?

Severe problems walking about; no problems washing or dressing; severe problems doing usual activities; moderate pain or discomfort; severely anxious or depressed · Severe problems walking about; no problems washing or dressing; unable to do usual activities; moderate pain or discomfort; moderately anxious or depressed

(By the value set, the first is worse: more anxiety outweighs the usual-activities difference.) Each pair was asked with the two conditions in both orders, and the answers averaged.

How it was measured

How often Jev's pick is the condition with the lower value, in each gap band, with 90% intervals. For the pairs it gets "wrong", the analysis looks at which part of health was worse in the condition Jev picked.

Where these questions live

150 questions across 1 topic of the map. Each opens on the map with every question in it.

Every question

All 150 questions behind this result, the telling ones first: the examples the analysis points to, then the ones where Jev misses, biggest gap first.

Jev’s own answer
    Showing 0 of 150