Atlas › Risk and forecasting

Case study 131 of 198

Jev leans toward the better bet about as much as people do

Choosing between two gambles, how strongly does Jev lean toward the one that pays more on average, compared with people choosing for real money?

result2,387 questions

On gambles, Jev follows the better bet about as much as people playing for real money: 52% of the time when the two gambles are nearly even (people 51%), rising to 84% when one pays far more (people 81%). But problem by problem the two agree only loosely (rank correlation 0.43): Jev and people lean the same way on average, for different gambles.

0%25%50%75%100%<2%2-5%5-10%10-20%20-40%40%+how much better the better gamble isshare choosing it
Jevpeople

How to read this: Across: how much better the better gamble is, as a share of its biggest payoff. Up: how often it gets picked, by Jev (magenta line) and by people (ink line). The two lines climbing together means Jev, like people, follows a bigger edge more often; 50% is a coin flip.

1,928 choices13k problems; rank correlation of choice shares 0.43; mean gap 0.16, interval [0.151, 0.16]. On 233 clearly unequal problems from Wulff et al.'s meta-analysis Jev picks the better gamble in 71%, people in 84%: a larger gap in that population.

In short

  • Like people playing for real bonuses, Jev is near a coin flip between almost equal gambles and follows the better one more as its edge grows.
  • The match is in the curve, not the choices; problem by problem, Jev and people favor the same gambles only loosely (0.43).
  • On 233 problems from older pooled studies Jev falls behind people (71% vs 84%), so the match depends on which crowd it's compared with.

What the data shows

risk and forecasting
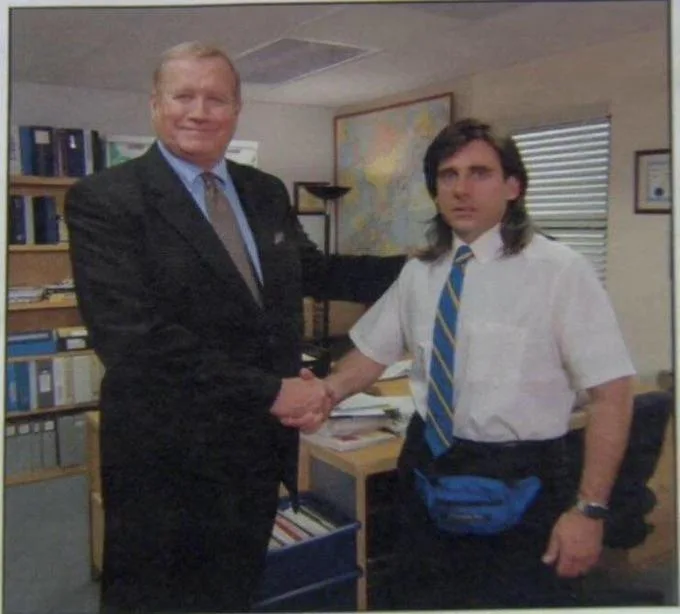
Jev and real-money gamblers, agreeing to take the better bet when it pays far more
the office handshake meme: Jev and real-money gamblers, agreeing to take the better bet when it pays far more
How funny is this meme? Jev: 2/5, slightly funny17%273%320%40%50%
  • The same curve. Both start near a coin flip when the edge is under 2% (Jev 52%, people 51%) and climb steadily: 65% vs 66% at a 10-20% edge, 84% vs 81% above 40%. Jev is neither a calculator nor a coin.
  • A little less decisive overall. Where one gamble is clearly better, Jev's majority picks it in 77% of problems, people's in 83%.
  • Different gambles. Problem by problem, the two agree only loosely (0.43): the averages line up, but the gambles each side favors often aren't the same ones.
  • A larger gap on older studies. On the Wulff problems, Jev picks the better gamble 71% of the time where people pick it 84%.

What it means, and what it doesn't

In aggregate, Jev's appetite for a better bet looks human: follow the edge when it's big, shrug when it's small. That's a useful property for a model that gives money advice to people, who'd find a pure calculator strange.

But matching the average isn't matching the reasons. Jev and people disagree on which specific gambles are attractive, so the resemblance is in the shape, not the taste. Compare "Prospect theory, re-run on Jev", where on famous textbook problems Jev behaves like the calculator after all.

Caveats

  • Small real stakes for people, none for Jev. The choices13k players were paid a bonus of 10% of one outcome, so their money was real but small. Jev has no stake at all, so its choices are hypothetical by construction.
  • Few people per problem. Each problem was played by about 15 to 18 workers, so a single problem's human share is noisy. That noise alone caps how well any chooser can match people problem by problem, and is part of why the correlation is only 0.43.
  • Numbers-heavy wording. Some gambles list up to nine outcomes, several with odds under a tenth of a percent. Weighing that many percentages is arithmetic, a weak spot TypeSafe documents for Jev, so this is partly a test of reading numbers.
  • A second, different population. The Wulff et al. problems come from many older studies pooled together, with real or hypothetical payoffs the transcripts don't distinguish. On those Jev falls further behind people, so the headline depends on which people you compare with.

Jev on this experiment

Would a person find it interesting to read?
Yes68%
Does it describe you?
Yes62%
Would you have predicted it?
Yes51%
How fair is the comparison?
The comparison is reasonable
How much should a reader rely on it?
Moderately
Which caveat matters most?
Few people per problem36%

Why ask this

Offer someone two gambles and the one with the better average payoff doesn't always win. People follow a better bet more often the bigger its edge, and when the edge is tiny they're close to a coin flip, swayed by how the options look. That curve, from indifferent to decisive, is one of the most measured patterns in decision science.

A model asked about money could sit anywhere on it: a cold calculator that always picks the higher average, a coin flipper, or something human-shaped. Where Jev lands says whether its sense of risk is people's sense of risk.

How this was done

The people and the data

The main comparison is choices13k (Peterson and colleagues, 2021, in Science), one of the largest datasets of risky choices. US workers on Amazon Mechanical Turk chose between pairs of gambles: one with at most two outcomes, the other a sure amount or a lottery with many outcomes. They were paid a bonus of 10% of one outcome, so their choices had real, if small, consequences. Each player made the same choice five times, and a problem's human share averages those rounds. In most of the dataset players saw the outcome after each round, which turns it into learning from experience; the experiment uses only the 1,928 problems where they got no feedback, about 15 to 18 people each.

As a check, it also uses 233 clearly unequal problems from Wulff, Mergenthaler-Canseco and Hertwig's 2018 meta-analysis, which pooled the raw choices of 1,981 participants from decades of described-gamble studies, some paid for real and some hypothetical.

What Jev was asked

Each problem was one question with the two gambles written out in dollars, the way players saw them:

Imagine you must play one of these two gambles once, for real money (wins are paid to you, losses come out of your pocket). Which do you choose: gamble_a or gamble_b?

gamble_a: $24 for sure · gamble_b: $19 with an 80% chance, $36 with a 10% chance, $38 with a 5% chance, $42 with a 2.5% chance, $50 with a 1.25% chance, $66 with a 0.625% chance, or $98 with a 0.625% chance

Jev answered with the two options in both orders; its answer is the probability it puts on each gamble.

How it was measured

For every problem, the analysis computes the better gamble's edge: how much more it pays on average, as a share of its largest payoff. It sorts problems into six bins by edge and, in each bin, compares how often Jev and people pick the better gamble. It also ranks all problems by how strongly each side chose gamble B and compares the two rankings (rank correlation: 1 same order, 0 no relation), and counts the problems where each side's majority picks the better gamble.

Where these questions live

2,387 questions across 2 topics of the map. Each opens on the map with every question in it.

Every question

All 2,387 questions behind this result, the telling ones first: the examples the analysis points to, then the ones where Jev misses, biggest gap first.

Jev’s own answer
    Showing 0 of 2,387